
GEOCHEMICAL ANALYTICAL TECHNIQUES AND INTERPRETATION
C.J. MATCHETTE-DOWNES
Analytical techniques and interpretation
The following describes the main methods used in petroleum exploration geochemistry
1. SAMPLE PREPARATION 1.1 Introduction
Samples are received in the form of canned well-site cuttings, bagged cuttings, cores, outcrop samples or crude oils. Each sample is examined visually and described; contaminants such as drilling mud additives and caved material are removed. The drilling mud is removed with cold water, unless they are oil based: then the samples are washed in dichloromethane. Once dried the rock samples are divided for optical and molecular analysis. The optical fraction is ground to µm and the fraction for molecular analysis ground to (<212µm). Condensates and crude oils are separated into fractions by liquid chromatography or diluted as appropriate prior to analysis. Headspace gases are analysed directly.
1.2 Kerogen preparation
Samples requiring kerogen analysis are finely ground as for optical analysis, treated with excess hydrochloric acid to remove the carbonates and finally treated with excess hydrofluoric acid (HF) to remove any silicates. The kerogens are then washed, dried and mounted on a glass slide for viewing in transmitted light for spore coloration (SC) and kerogen type analysis.
1.3 Solvent extraction
Approximately 100 grams of finely ground rock (<212um) is refluxed in a Soxhlet apparatus for 18 hours with an azeotropic mixture of dichloromethane/methanol (93:7). Any elemental sulphur is removed by activated copper turnings. The solvent and extract are then decanted and reduced to dryness by means of a rotary evaporator. The total weight of the extract is recorded.
The separation of the samples into aliphatic and aromatic hydrocarbons is achieved by liquid column chromatography (LC) or thin layer chromatography (TLC) depending on how much sample material is required. Liquid chromatography provides sufficient sample for several analyses. The oil or extract sample is dried onto deactivated alumina and placed on an alumina : silica column (1:3). The aliphatic hydrocarbon fraction is eluted with pentane, whereas the aromatic hydrocarbon fraction is firstly partially eluted with a pentane and 10% dichloromethane mixture, then with a 20% dichloromethane pentane mixture. These resulting fractions are stored for further analysis. When less sample material is required TLC is used to separate the aliphatic from the aromatic hydrocarbons. Pre-prepared silica gel plates are first conditioned, spotted with oil or extract material and then developed in hexane. An accurate percentage breakdown of the oil or extract into saturate and aromatic hydrocarbons, resinous compounds and asphaltenic compounds (SARA) is achieved by the Iatroscan method. The Iatroscan method uses automated combined TLC with a flame ionisation detector (TLC/FID).
The asphaltenes may be collected by precipitation overnight in hexane. The precipitate is filtered off, dried, weighed and stored for analysis.
2. MATURITY EVALUATION
Optical microscopy is the main technique used for maturity estimation in solids. Three techniques are typically: Vitrinite reflectance (Ro%), spore fluorescence (SF) and spore coloration (SC). Further maturity evaluation techniques used include: Rock Eval pyrolysis and Tmax determination; in both these source rock extracts maturity is assessed by examining the n-alkane distributions, the biomarkers and the aromatic hydrocarbon ratios by gas chromatography (GC) and gas chromatography-mass spectrometry (GCMS).
2.1 Vitrinite reflectance
The whole rock technique is preferred; however, when there is insufficient suitable material on which to make the measurements isolated kerogen mounts are also examined in reflected light. The crushed sample is mounted in a liquid polystyrene resin, allowed to harden, ground on successively finer carborundum paper, and then polished with successively finer alumina powders. The samples are then viewed under reflected light using a (Leitz) photometric microscope with reference to optical standards the samples are viewed in white light using oil immersion objectives and a green filter with a peak transmission of 546nm. The immersion oil has a refractive index (Nt) of 1.518 at 23°C. The values are recorded as a percentage of light reflected. Changes in reflectance values greater than Ro 0.1% are thought to be significant. Typical standards used are: Yttrium aluminum garnet (YAG) Ro% 0.921, and artificial sapphire Ro% 0.504.
Considerable operator skill is required to distinguish between autochthonous and allochthonous vitrinitic components, other features such as degree of bitumen staining, mineralogy, micropalaeontology and oxidation effects arc also noted. Values of vitrinite reflectance with reference to the oil and gas window may be seen in the figure entitled "correlation title, molecular parameters". (Fig. 1).
Reflectance measurements are particularly reliable above Ro 0.5%; below this value other parameters are used. In immature rocks, the reflectance changes erratically with increasing maturity.
In lithologies subjected to recent rapid subsidence, in zones of oil ingress and in horizons of intense reworking vitrinite reflectance values may well be unreliable or even unavailable.
2.2 Spore fluorescence
The degree of sample fluorescence is determined by observing the excitation colours when the sample is irradiated with UV light. This type of illumination causes certain components e.g. spores, algae, plant waxes, cutinite and oil, to fluoresce. The fluorescence colour observed depends on the maceral type and maturity. It is therefore important that the determinations are made on one maceral type. Spores have been found to be the most reliable fur maturity assessments.
Table 1. Spore fluorescence scale
| 1. Green-yellow |
| 2. Yellow |
| 3. Light range |
| 4. Mid-orange |
| 5. Dark orange |
| 6. Red |
| 7. Brown |
The correlations between the fluorescence colour number, the maturity and the other maturity parameters are displayed in Fig. 1. The SF technique is particularly useful for the maturity range Ro 0.3 to 1.0%. It can be extended to levels of maturity up to 1.3%. Fluorescence observation is also a useful tool to determine the extent and the amount of bitumen staining.
2.3 Spore colour
This technique is extremely useful in the immature to early zone of oil generation. The technique uses transmitted light microscopy. The colour determination of suitable spores is made by eye with reference to a standard set of spores. The spore colour index (SCI) value is obtained by referring to the conversion able overleaf`:
Table 2. Spore colour conversion table
| 1.0 Colourless |
| 1.5 Colourless - pale yellow |
| 2.0 Pale yellow |
| 2.5 Pale yellow - lemon yellow |
| 3.0 Lemon yellow |
| 3.5 Lemon yellow - golden yellow |
| 4.0 Golden yellow |
| 4.5 Deep yellow |
| 5.0 Yellow - orange |
| 5.5 Light orange |
| 6.0 Mid - orange |
| 6.5 Dark orange |
| 7.0 Orange - brown |
| 7.5 Light brown |
| 8.0 Mid - brown |
| 8.5 Dark brown |
| 9 0 Very dark brown |
| 9.5 Brown - black |
| 10 Black |
SCI increases with increasing maturity. Figure 2 shows the correlation between SCI value, the oil window and other maturity parameters.
2.4 Pyrolysis (Rock Eval)
This screening technique. provides parameters which are both measures of maturity and kerogen type. Tmax can be a useful indicator of maturity; 435°C ±10%: marks the transition from immature to mature organic matter. Values in the range. 435 to 460°C ±10%: represents the peak oil generation (the oil window). Values of 455 to 460°C ± 10% represent the transition from oil to wet gas generation. The Hydrogen Index (HI, defined under source rock evaluation) is also used as a maturity indicator. HI) will decrease with increasing maturity as labile hydrogen-rich compounds leave the kerogen nucleus.
2.5 Gas chromatography (GC)
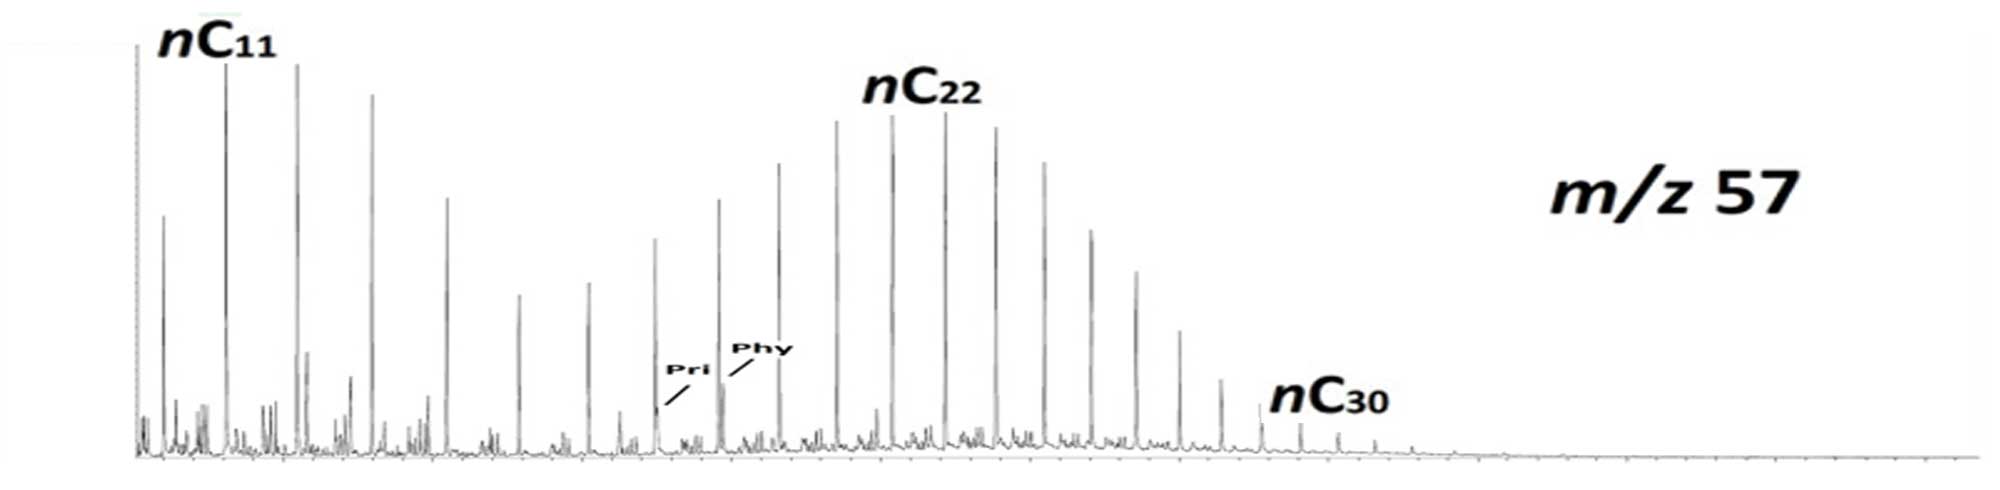
Analyses are undertaken using a gas chromatograph equipped with a data station and integrator. The capillary column typically used is a 25m x 0.15mm id. (narrow bore) fused silica column, wall-coated with 0.12mm of a cross-bonded non-polar phase Silica. The oven temperature is held at 500C for one minute, then raised to 320C° at 5°C-min The n-alkane distribution may reveal the maturity of the precursor source rock or be the result of subsequent alteration. Careful interpretation will reveal which is the case.
2.6 Gas chromatography-mass spectrometry (GC-MS)
Mass spectrometry is used to identify characteristic compounds found in oils and source extracts. It is a considerably more powerful and specific technique than GC FID.
A typical GCMS set up may be a VG trio Quadrapole instrument coupled to an HP 8150 GC. The instrument is operated in both the full scan (SCN) and selected ion mode (SIR). The sample is introduced using an `On Column Technique'. The column type is virtually the same as that used in the Philips GC. However a slightly wider bore is needed to accommodate the capillary syringe needle.
When the instrument is operated in SIR mode it is set to monitor ions specific to certain classes of biomarkers. Both aliphatic and aromatic hydrocarbons are monitored. At present the aliphatic groups are monitored: triterpenoidal hydrocarbons (m/z 191, 123); steroidal hydrocarbons (m/z 217, 218, 231, 259 & 273); bicylics (m/z 123) are also monitored. The aromatic fraction is monitored for the mono-aromatic steroidal hydrocarbons (m/z 253), tri-aromatic steroidal hydrocarbons (m/z 231 and m/z 245), phenan¬threnes (m/z 192 & 178), naphthalene and the methylated naphthalene compounds (m/z 142, 156, 170, 184). Ratios are calculated for certain components (eg. sterane 20S:20R), whose stereochemistry depends on maturity; these ratios are normally calculated in the form of product /(product + reactant).
3. SOURCE ROCK EVALUATION
3.1 Bulk techniques
3.1.1 TOTAL ORGANIC CARBON
Total organic carbon (TOC) is determined by treating a small aliquot of the crushed sample with concentrated HCl to remove the carbonates. The sample is washed with distilled water, dried and analysed in duplicate in a LECO furnace.
The measurement provides a direct determination of the TOC present in rock samples. In general, shales with TOC values below 1.0% wt. are not considered prospective sources for generation of commercial quantities of oil or gas.
The TOC values are interpreted follows:
3.1.2 PYROLYSIS
Once the amount of organic carbon has been established it is then necessary to determine the amount of hydrogen associated with the carbon. The higher the hydrogen content relative to carbon the better the source rock. This determination and other primary and derived values are determined using pyrolysis.
Pyrolysis data are obtained using the Rock Eval method. Analyses are undertaken using the Rock Eval OSA method. A small amount (100mg) of the crushed sample, selected on the above criteria, is weighed in a crucible, placed in the furnace by an autosampler and progressively heated. Initially the temperature is raised to 100oC and the volatile hydrocarbons are driven off (peak SO). The temperature is then progressively raised to 300°C. During this temperature ramp the heavier "free" hydrocarbons arc driven off (Peak S2). The temperature is further increased to 550°C. The higher temperatures result in the thermal degradation of any organic matter (kerogen) contained within the rock. All the released gases are detected by a flame ionisation detector (FlD). Peaks SO, S 1 and S2 are measured in mg HCg rock-1. The temperature at which the kerogen breaks down most readily is referred to as Tmax. This value is a useful indication of source rock maturity.
A guide to the interpretation of the S2 values and hence hydrocarbon potential is given below:
From the primary data a number of derived parameters may be recorded. The two most useful derived parameters are:
HI is a measure of the hydrocarbon generating potential of the kerogen (see table 3).
PI when used in conjunction with other PI data from the well-bore is a useful indicator of the amount of cracking the kerogen has undergone. It is also useful to delineate zones of inward and outward migration.
Tmax, H1 and P1 are dependent on maturity and kerogen type. Tmax values for immature kerogens are below 420oC± 10%. The perk oil window lies between 435 and 445°C. The late zone of oil generation and peak zone of condensate generation occurs between 445 and 455oC. Above 455°C only condensate and gas can be expected. With increasing maturity any generated gases will become progressively drier. It is thought that no further generation is possible beyond a Tmax of 500oC; this is the maturity equivalent of a vitrinite reflectance of approximately Ro 3.0%.
HI values will decrease with increasing maturity; the exact values will depend very much on the starting values. As an example H1 values above 550 would indicate an immature highly aliphatic oil-prone kerogen. Values below 200 may indicate an immature non-aliphatic kerogen or a fully mature formerly hydrogen-rich kerogen. See Fig.2.
3.2 Kerogen type
Optical techniques, microscopy
During the measurement of maturity by all methods, a note is also made of the amount and types of the various kerogen types. A classification using our broad kerogen types is used: (Types I, II, III and IV). Sec also the Van Krevelan diagram, Fig.2.
Samples containing sufficient Type I or II kerogens have the potential to generate oil; under increased thermal stress gas will be generated.
Type III kerogens mainly generate gas with only ii small amount of oil, whereas Type IV have little or no potential to generate anything.
The Type of kerogen present in sample also provides some indication of the environment of deposition in which the rock was deposited. For example algae, Type I kerogen, may indicate either a lacustrine (e.g. Botryococcus or a marine environment (e.g. Tasmanites). Type II kerogens are largely confined marine shelfal environments. Type Ill kerogens are derived From continental organic material but the organic matter can be transported beyond paralic swamps well into the marine environment (duplex source). Primary inertinite, type IV kerogens, and of continental, origin can also be transported to a variety of environments. The presence of inertinite dilutes the source rock's potential (the active carbon is reduced). All four kerogen types are just convenient end members in a continuum. Determining the HI will give a bulk determination of oil or gas potential, but HI values are less useful for a palaeoenvironmental examination, to establish environments of deposition completely a combined organic petrological-paly¬nological approach is used.
Kerogen typing is also used to help determine maturity. Organic matter becomes progressively darker with increasing maturity: the degree of darkness, the Thermal Alteration Index (TAI) has been given an ascending series of values from approximately 2 to 4. In this study values of TAI derived from Service Company reports were converted to Ro% using Table 4 (Warples 1980).
3.3 Molecular techniques and interpretation
Gas chromatography (GC), Gas chromatography-mass spectrometry (GC-MS), prior to undertaking any GC or GC-MS analyses a standard oil is analysed to ensure consistency and highlight any possible problems, n-Alkane distributions, biomarker and other compound profiles derived from the analysis from solvent extracts can also provide useful information on kerogen type and depositional environment for the source rocks; this approach is used to examine the oils in detail to gain further information about presumed source rocks.
The type of data may include:
The position of the n-alkane maxima and distribution of the n-alkanes may indicate whether marine (C15 - C20) or terrestrial (C27 - C33) organism have contributed to the kerogens.
The relative amounts of pristane (Pr) to phytane (Py) are thought likely to indicate redox conditions that existed when the sediments were deposited.
There are many other useful parameters: in addition, the presence of other compounds such as iso¬prenoids and unresolved material are noted.
Biomarker profiles derived from GC-MS analyses also contain valuable data which can give clues as to the origin of the sediment. For example the ratio C27 : C28 : C29 steranes have been used extensively to differentiate between marine and terrestrial input recent research has thrown some doubt on the usefulness of this ratio and many others. In practice the interpretation of these ratios is only undertaken with caution and in conjunction with all other available data.
A table of GCMS derived parameters and characteristic ions normally used is included in the appendix (see tables 5 and 6).
Prior to any GCMS or GC run a standard oil is analysed to check the instrumentation. For the North Sumatran work a Tertiary oil from central Sumatra was used for GCMS work and the Villeperdue oil from the Paris basin for the GC work. (see Figs. 3 GC n- and iso-alkanes, GCMS aliphatic hydrocarbons, triterpanoids and GCMS aromatic hydrocarbons, steroidal hydrocarbons.
4. CORRELATION, ALTERATION & MIGRATION
4.1 Introduction
GC and GCMS and isotope techniques are also used in correlative, migration and oil alteration studies. The analysis of the stable isotopes of carbon, hydrogen, sulphur and, to a lesser extent, nitrogen can he particularly useful in correlative, maturity, palaeoenvironmental, oil alteration and migration studies. The data are used in conjunction with other geochemical parameters. In this study only carbon isotopes were used to help reconstruct the palaeoenvironment. Fig. 7 explains the units used, Fig. 8 shows the range of 13C‰ values that occur in nature and Fig. 9 describes the stable carbon isotopic changes that occur in kerogens and breakdown products.
4.1.1 CORRELATION STUDIES
Using the molecular and isotopic techniques possible oil, gas and source rock correlations may be investigated. The same data may also be used in migration studies.
4.2 Alteration studies
Once reservoired or during migration, oil may be altered and the original characteristics lost. The principle modes of alteration arc: biodegradation, waterwashing, asphaltene precipitation, UV alteration and evaporation. In all processes expect asphaltene precipitation the resulting oil becomes heavier and more viscous.
4.2.1 BIODEGRADATION
This also includes enzymic alteration. Biodegradation will only occur below a maximum temperature of 80°C. Additionally a supply of waterbourne nutrients is required. Biodegradation often follows a set path, with the more readily digestible compounds being selectively removed first. To establish the extent of biodegradation in mature oils a scheme has been adopted from Alexander et al. 1983, see Table 7.
4.2.2 WATER-WASHING
The more water-soluble components of oil are removed sequentially by either ground water or formation waters. Generally water-washing and biodegradation occur simultaneously.
4.2.3 ASPHALTENE PRECIPITATION
This is an in-reservoir phenomenon only, Gas or low molecular weight hydrocarbons injected into a reservoir of oil will cause asphaltenic compounds to precipitate out from the oil and fall to the bottom of the oil column. In-reservoir gravity separation will also have this effect.
Long migration paths may result in heavier molecules or asphaltenic complexes being preferentially held back.
4.2.4 UV ALTERATION
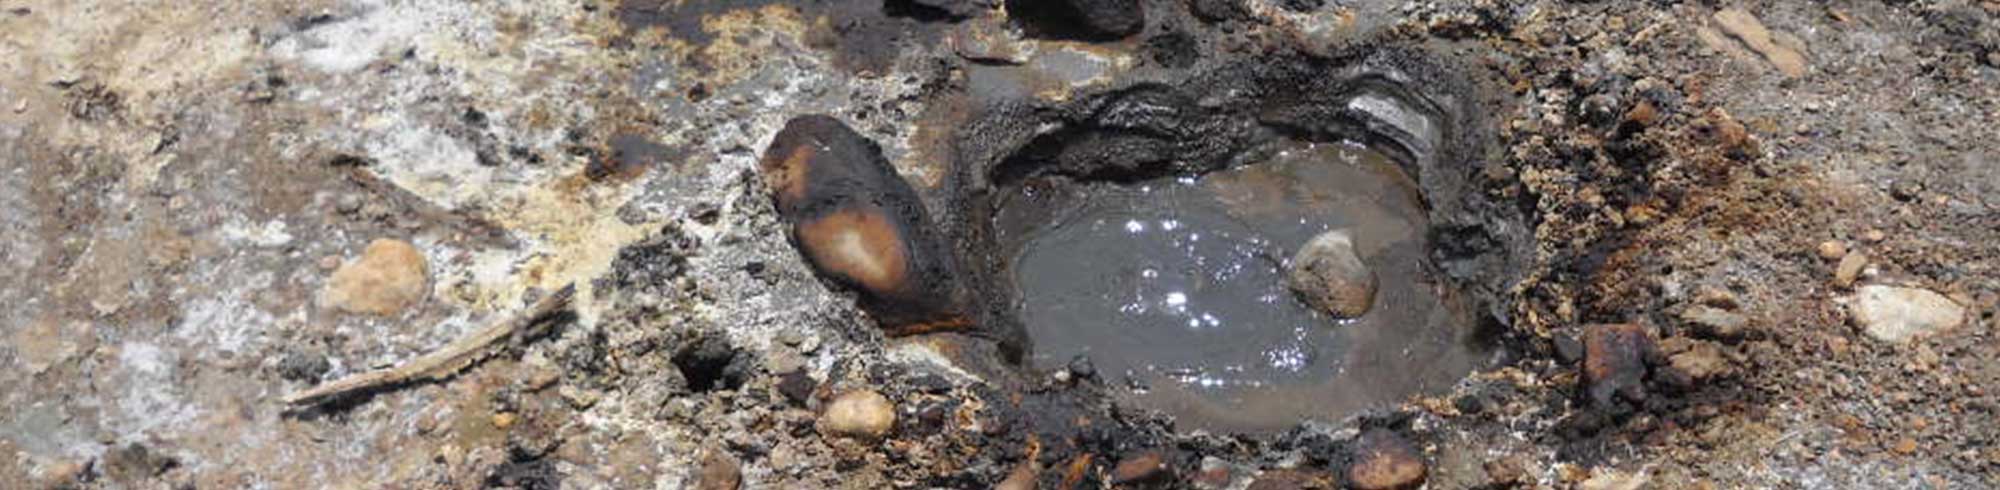
This is exclusively a surface phenomenon Therefore it will be encountered only at oil seeps and in surface pools of oil. UV irradiation causes photochemical destruction of many hydrocarbon species.
4.2.5 EVAPORATION
Again this is exclusively a surface effect. The lighter more volatile hydrocarbons will be preferentially lost; this process is termed impissation.